- Capital Sync Newsletter
- Posts
- 🟡 Is Gold Ready to Continue Its Bullish Run?
🟡 Is Gold Ready to Continue Its Bullish Run?
From Structure to Execution: Where Gold Might Head Next, and How to Prepare
Capital Sync
November 08, 2025
After a powerful rally, Gold (XAU/USD) seems to be in no rush to give back gains. Instead, it's entered into a consolidation phase on the Daily timeframe — a classic sign of the market taking a healthy pause before the next potential move. Let’s break down the case for continuation, and what traders need to watch out for.
📉 Daily Timeframe: Consolidation Mode
Gold is currently trading sideways, forming a tight consolidation area. This is often a strong base for continuation after an impulsive move — it allows the market to gather liquidity and institutional positioning before price expands again.
📍 Chart 1 – Daily Timeframe
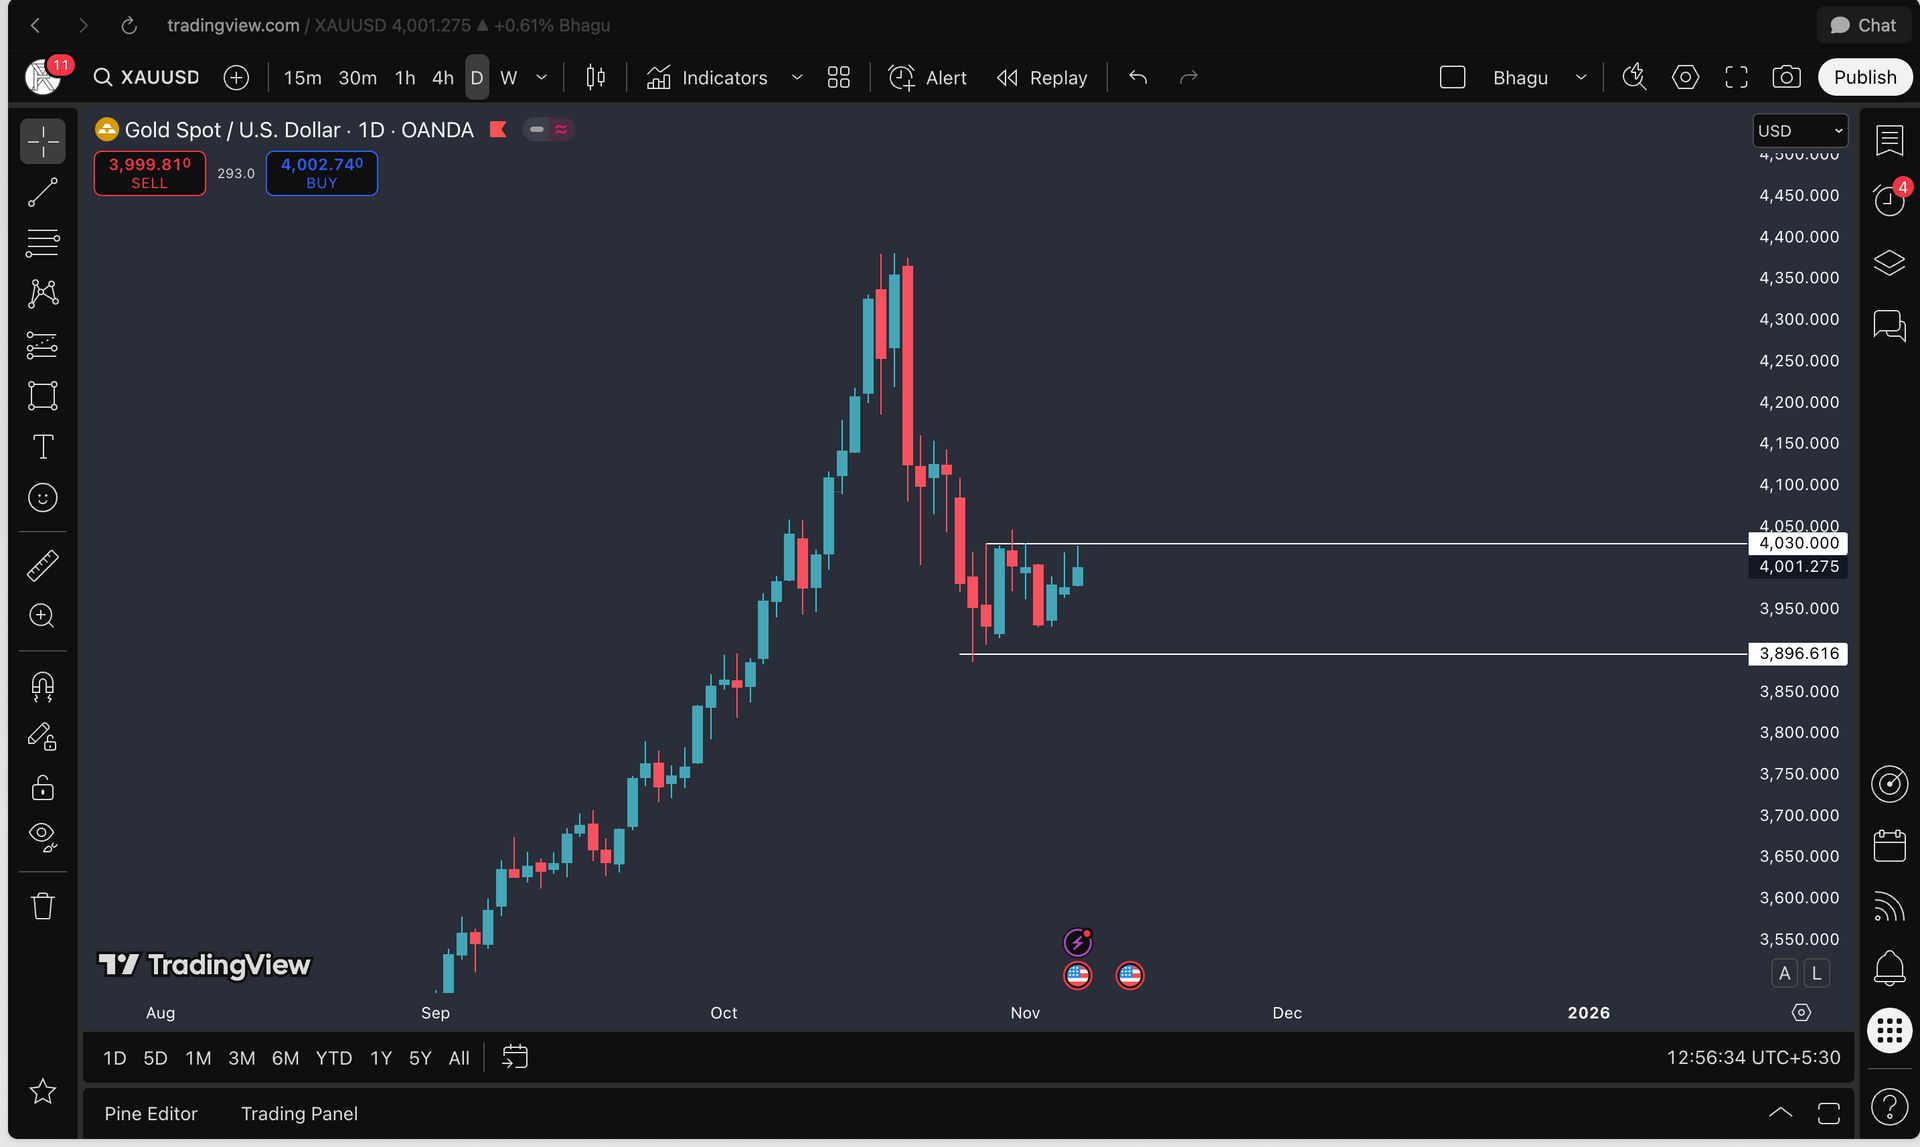
The key here is the $4,030 zone. A firm daily close above this level would likely open the path for the next leg up into new highs.
🕯 Weekly Timeframe: Bullish Candle with Rejection
Last week’s candle closed bullish, though with a smaller body. Importantly, it showed clear downside rejection — meaning sellers tried to push price lower, but buyers stepped in and reclaimed control.
📍 Chart 2 – Weekly Timeframe
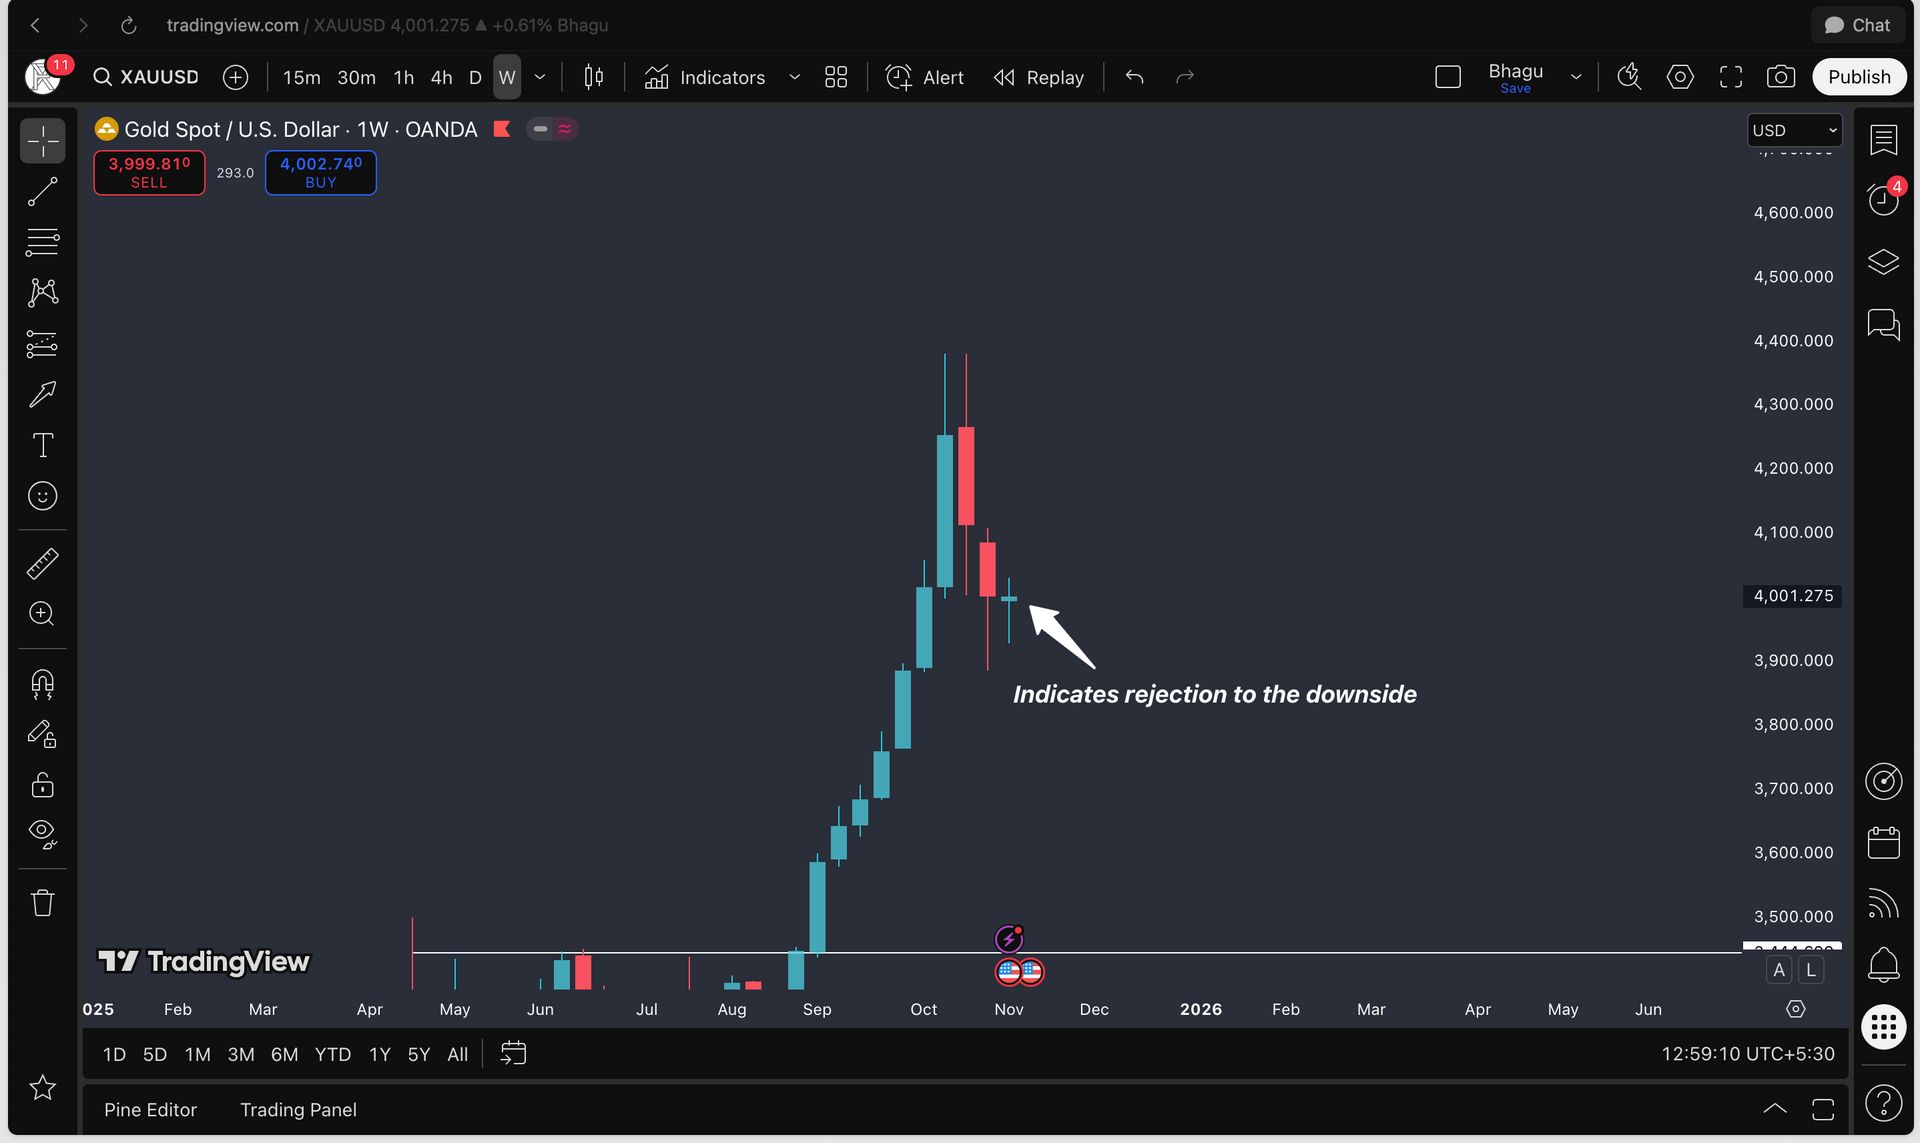
This wick behavior is one of the early signs of bullish intent, especially when aligned with the higher timeframe trend.
🗓 Monthly Timeframe: Wickfill + Range Extension
Zooming out further, the Monthly chart shows a big wickfill zone on the left side. This month’s candle has built a bottom wick and is now attempting to break its own high — that’s a bullish sign of continuation.
📍 Chart 3 – Monthly Timeframe
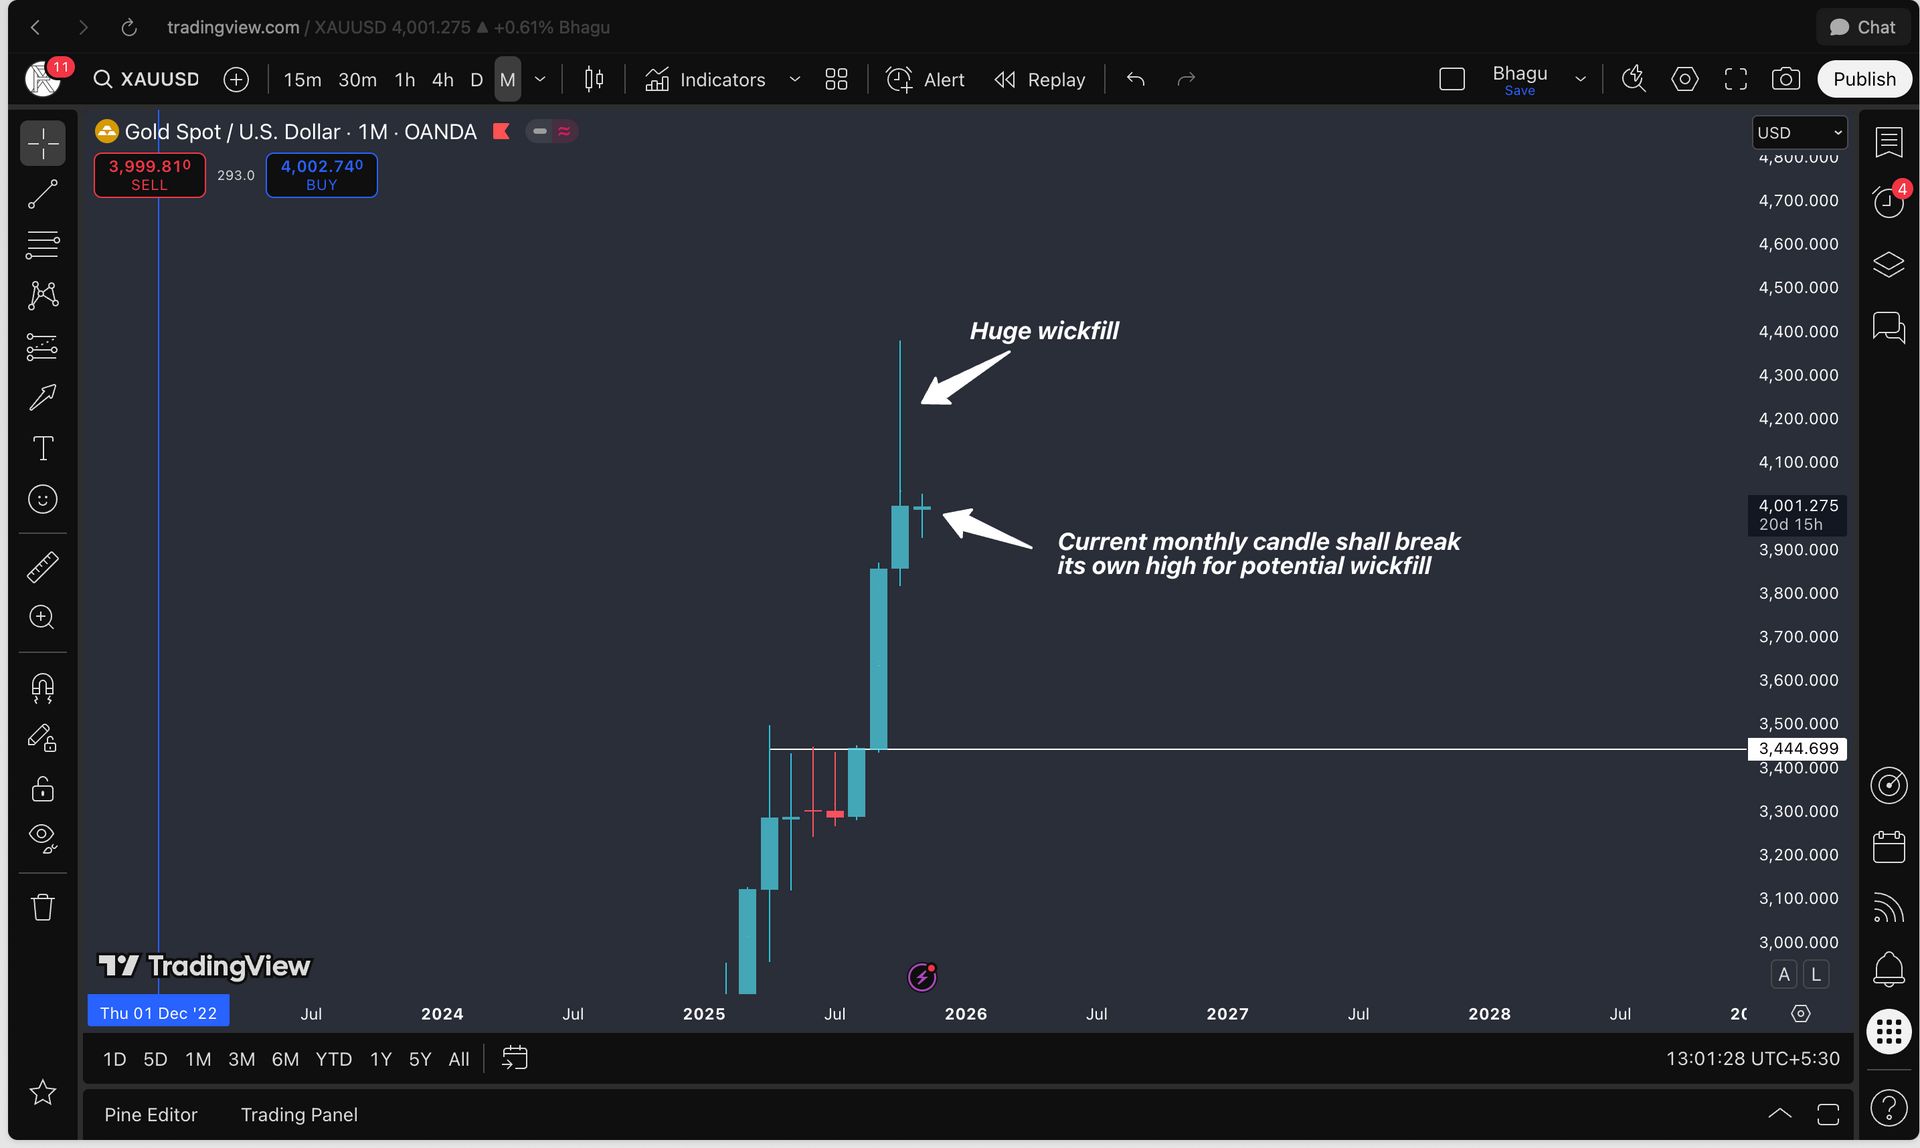
With more than half of November still left, there's plenty of space for price to stretch toward levels like $4,150, $4,200, and $4,250 — provided the structure remains intact.
🔄 What About Short Opportunities?
Price doesn’t move in a straight line. Even in a strong uptrend, lower timeframes will continue to offer sell-side moves — likely in the form of short-term corrections, liquidity grabs, or pullbacks.
If you're planning shorts inside this bullish context, make sure you're:
Trading against structure, so you must be aggressive with your trade management.
Aware of where the Daily/Weekly support zones and impulsive move points lie.
Prepared to cut quickly if the bullish bias resumes.
🔚 Conclusion
This is my current prediction based on multi-timeframe analysis:
Gold looks primed to continue pushing up once it breaks out of daily consolidation and sustains above $4,030.
That said, I’m always listening to what lower timeframes are printing, especially as I’m a day trader. The higher timeframes set the overall picture, but timing entries, exits, and managing trades come from lower timeframe behavior.
✅ Stay aligned with the bigger picture
✅ Use lower timeframes to manage risk and execution
🧠 Key Takeaway
The trend paints the picture, but the candle you trade writes the story — stay aligned with the higher timeframes, but let the lower ones guide your entries.
Bhagya Modi
Founder — Capital Sync