- Capital Sync Newsletter
- Posts
- Is Gold Signaling a Top — or Just Pausing for the Next Move?
Is Gold Signaling a Top — or Just Pausing for the Next Move?
After nine bullish weeks, Gold shows its first signs of exhaustion. Here’s what the charts — and global catalysts — are hinting next.
Capital Sync
October 25, 2025
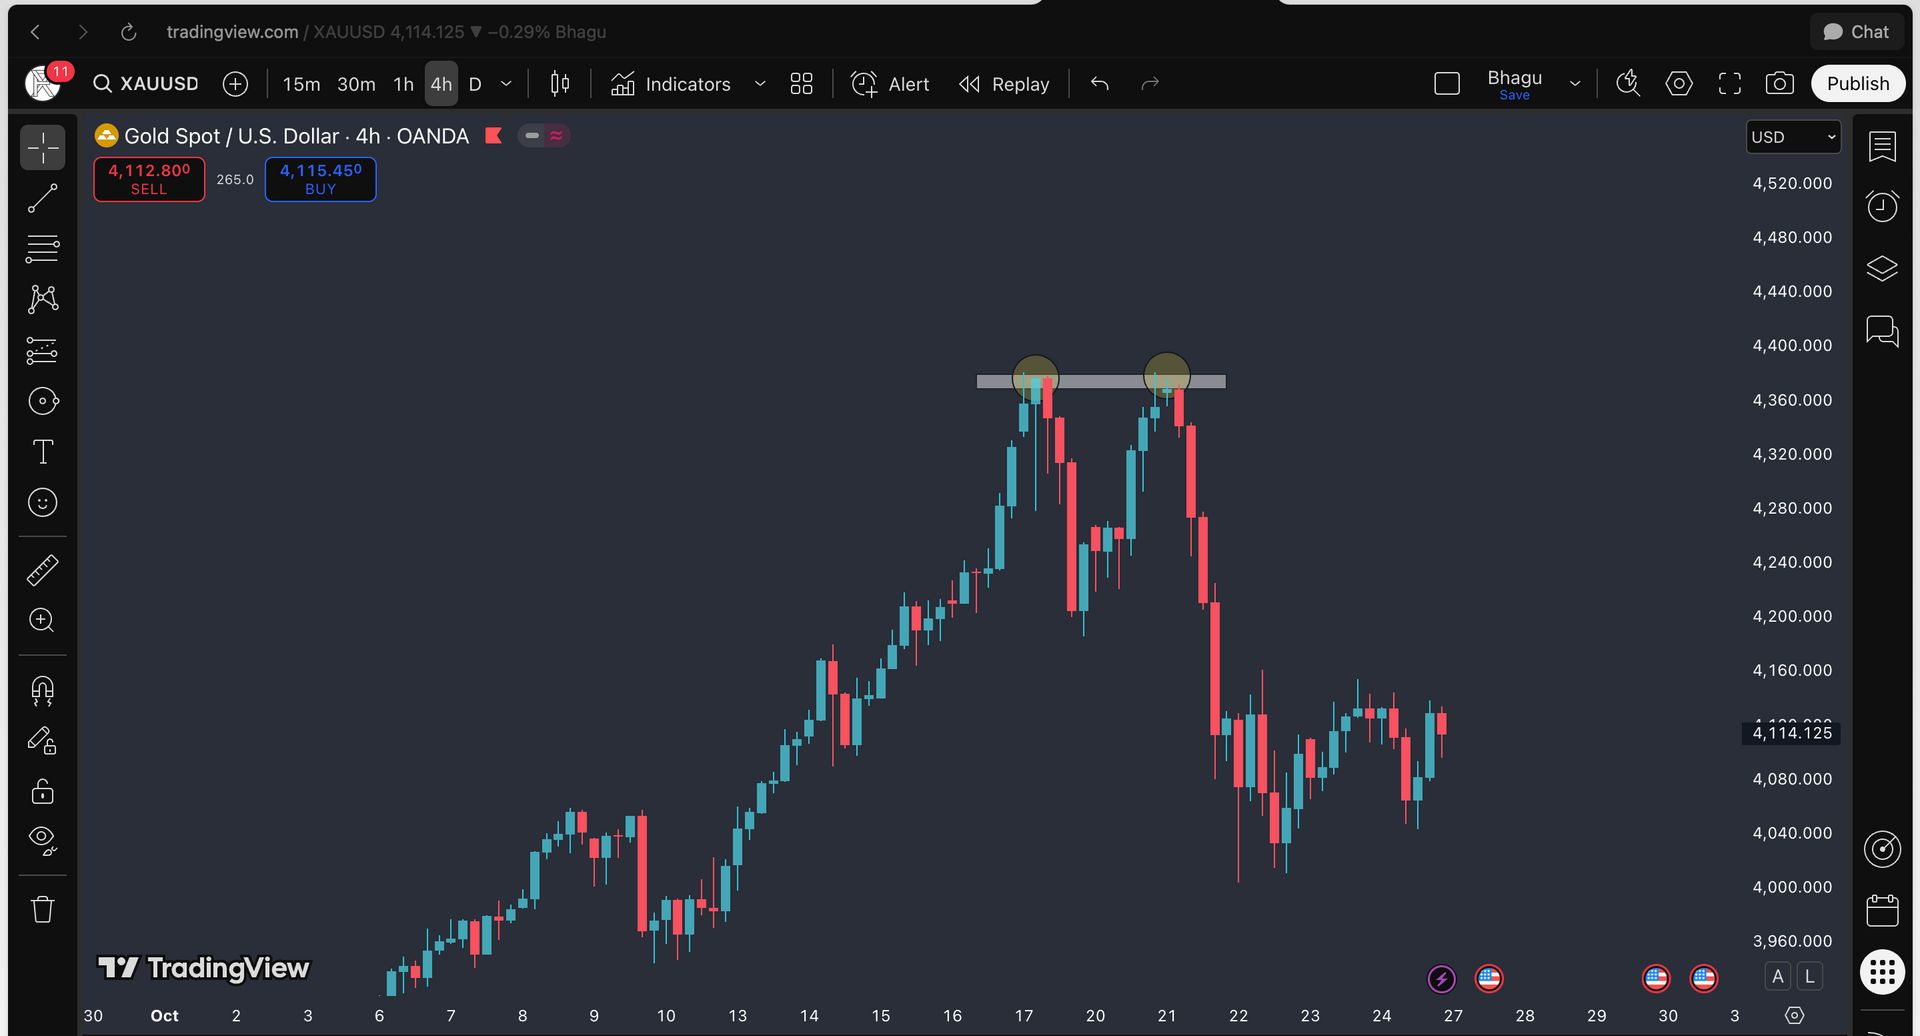
Over the past few sessions, Gold has shown a pattern that experienced traders will find familiar — a potential double-top structure forming near the highs. Historically, such formations have often led to strong retracements once momentum fades.
showing two touches at the top, followed by weakening candle bodies and fading volume, signaling exhaustion at higher levels. While the structure isn’t confirmed yet, the signs of consolidation are clear.
📊 Chart 1: Gold 4H Technical View
Adding to this, the 1-Week timeframe has printed its first bearish candle after 9 consecutive bullish weeks — a signal that momentum might be cooling off after an extended rally. Historically, such weekly reversals have triggered short-term retracements before the market rebalances.
📈 Chart 2: Gold 1W Timeframe
First bearish weekly close after a 9-week bullish streak — early sign of a potential retracement phase.
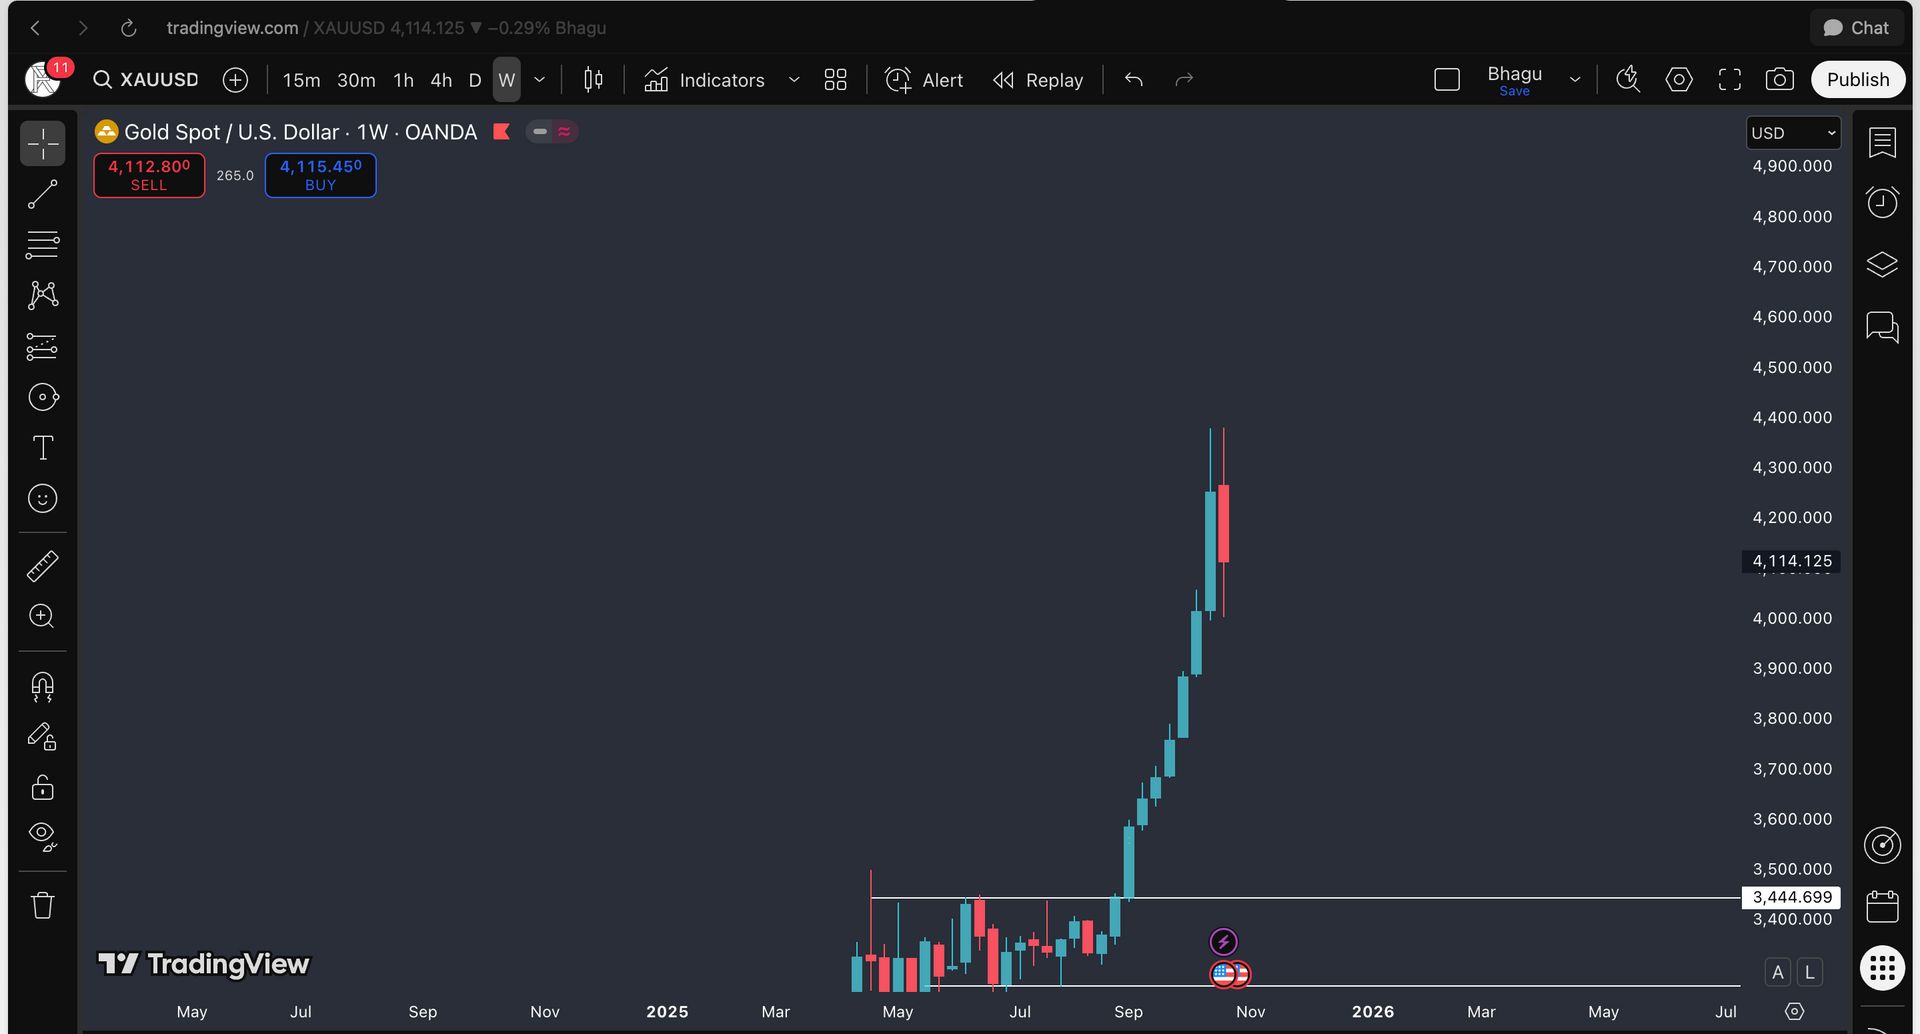
This doesn’t confirm a full reversal yet, but it does open the door for a correction, especially if macro catalysts align.
Speaking of catalysts — the upcoming Malaysia meeting between Trump and Xi Jinping will be the major macro event to watch. Any updates around U.S.-China trade relations could directly impact market sentiment:
A positive diplomatic tone may lift risk assets, pushing Gold lower.
Renewed trade tension or uncertainty could restore safe-haven demand, halting the pullback.
So while technicals hint at short-term weakness, fundamentals will decide whether this becomes a healthy retracement or a deeper correction.
To confirm the next phase of trend development, I’ll be closely monitoring the daily timeframe — watching for lower highs and lower lows to align with weekly bearish signals.
Once those structures confirm, the shift from short-term weakness to a broader downtrend becomes validated.
📊 Chart 3: Gold Daily Timeframe
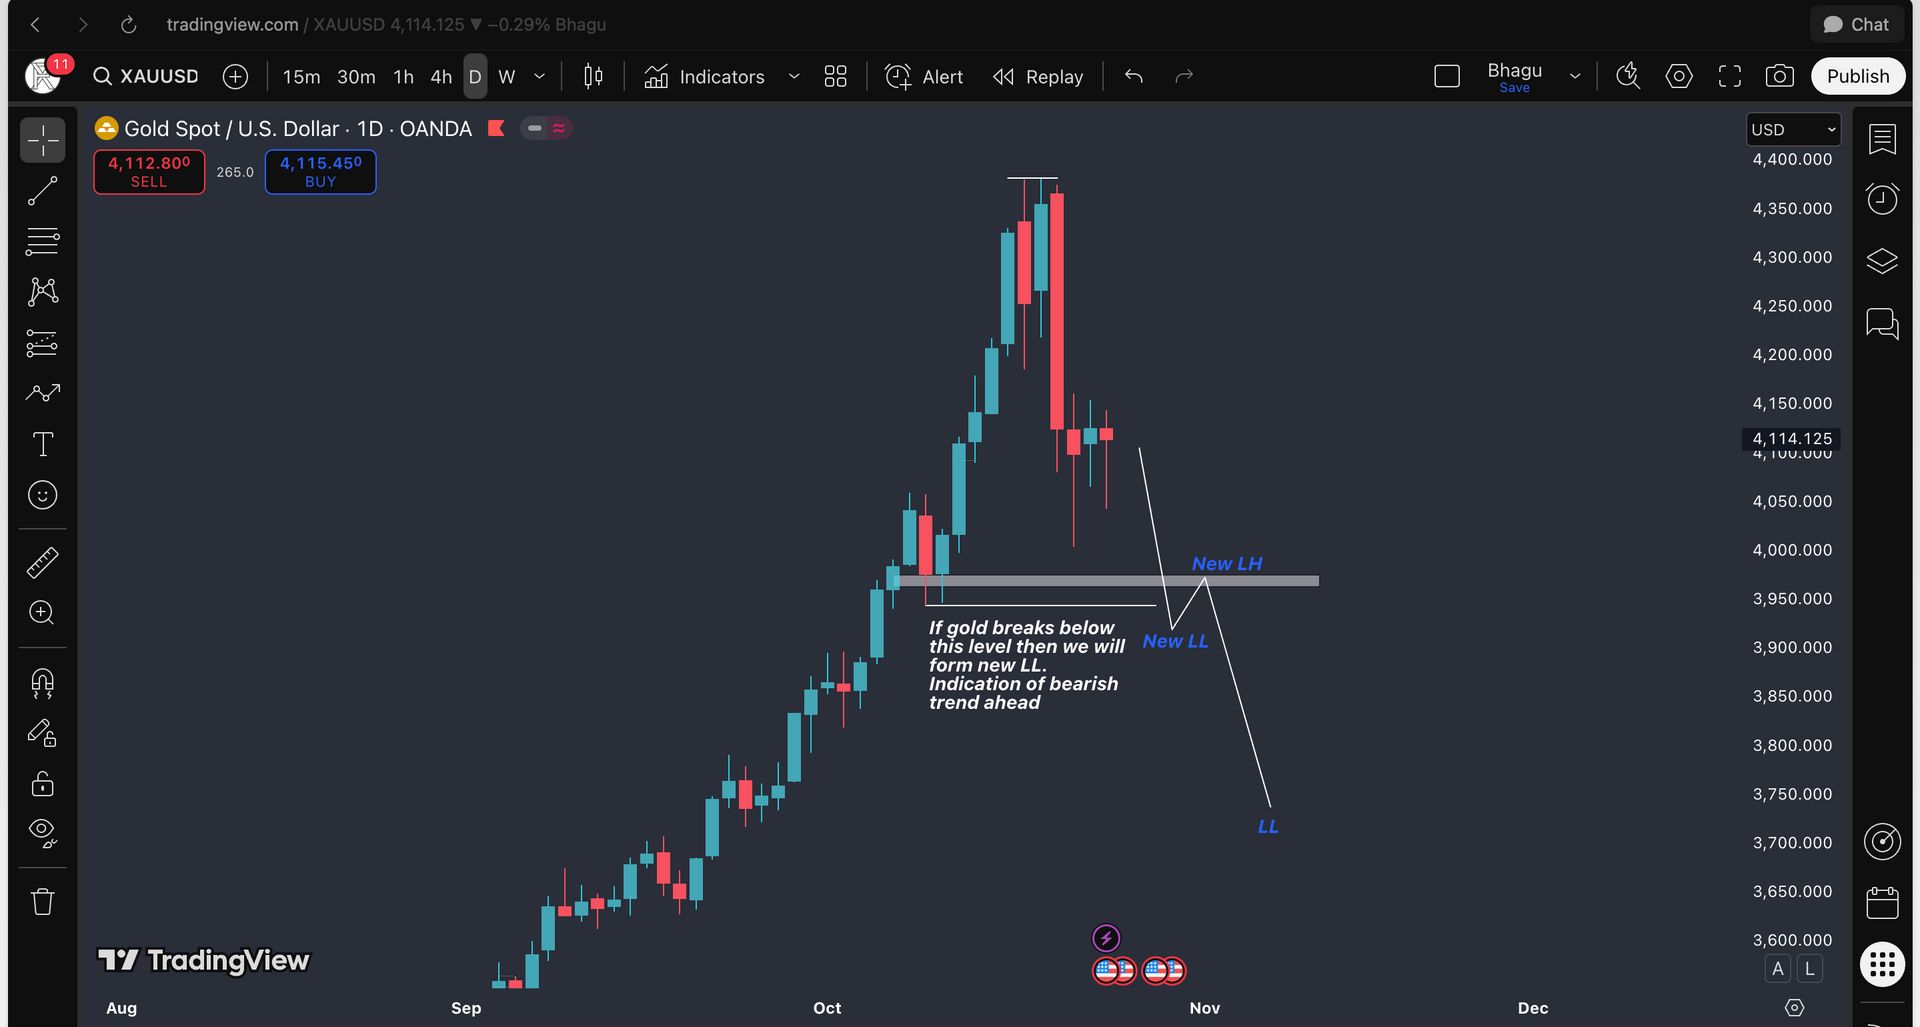
Gold giving this sort of confirmation on the daily timeframe will give us confidence, as it will show that Gold has formed a new lower low and lower high, marking the start of a potential downtrend. By doing that, it will also sustain below the strong $4000 price level, reinforcing the bearish structure.
Takeaway:
Gold might be hinting at a top, but confirmation always comes in structure — not speculation. The setup now favors a short-term retracement with potential for a deeper correction if the macro catalysts align. Let the technicals guide your timing, and let fundamentals validate your conviction.
— Bhagya Modi
Founder, Capital Sync